
The Foreqast Table
The heart of the app: one living grid that turns your booked accounting data into a rolling cashflow and P&L forecast.
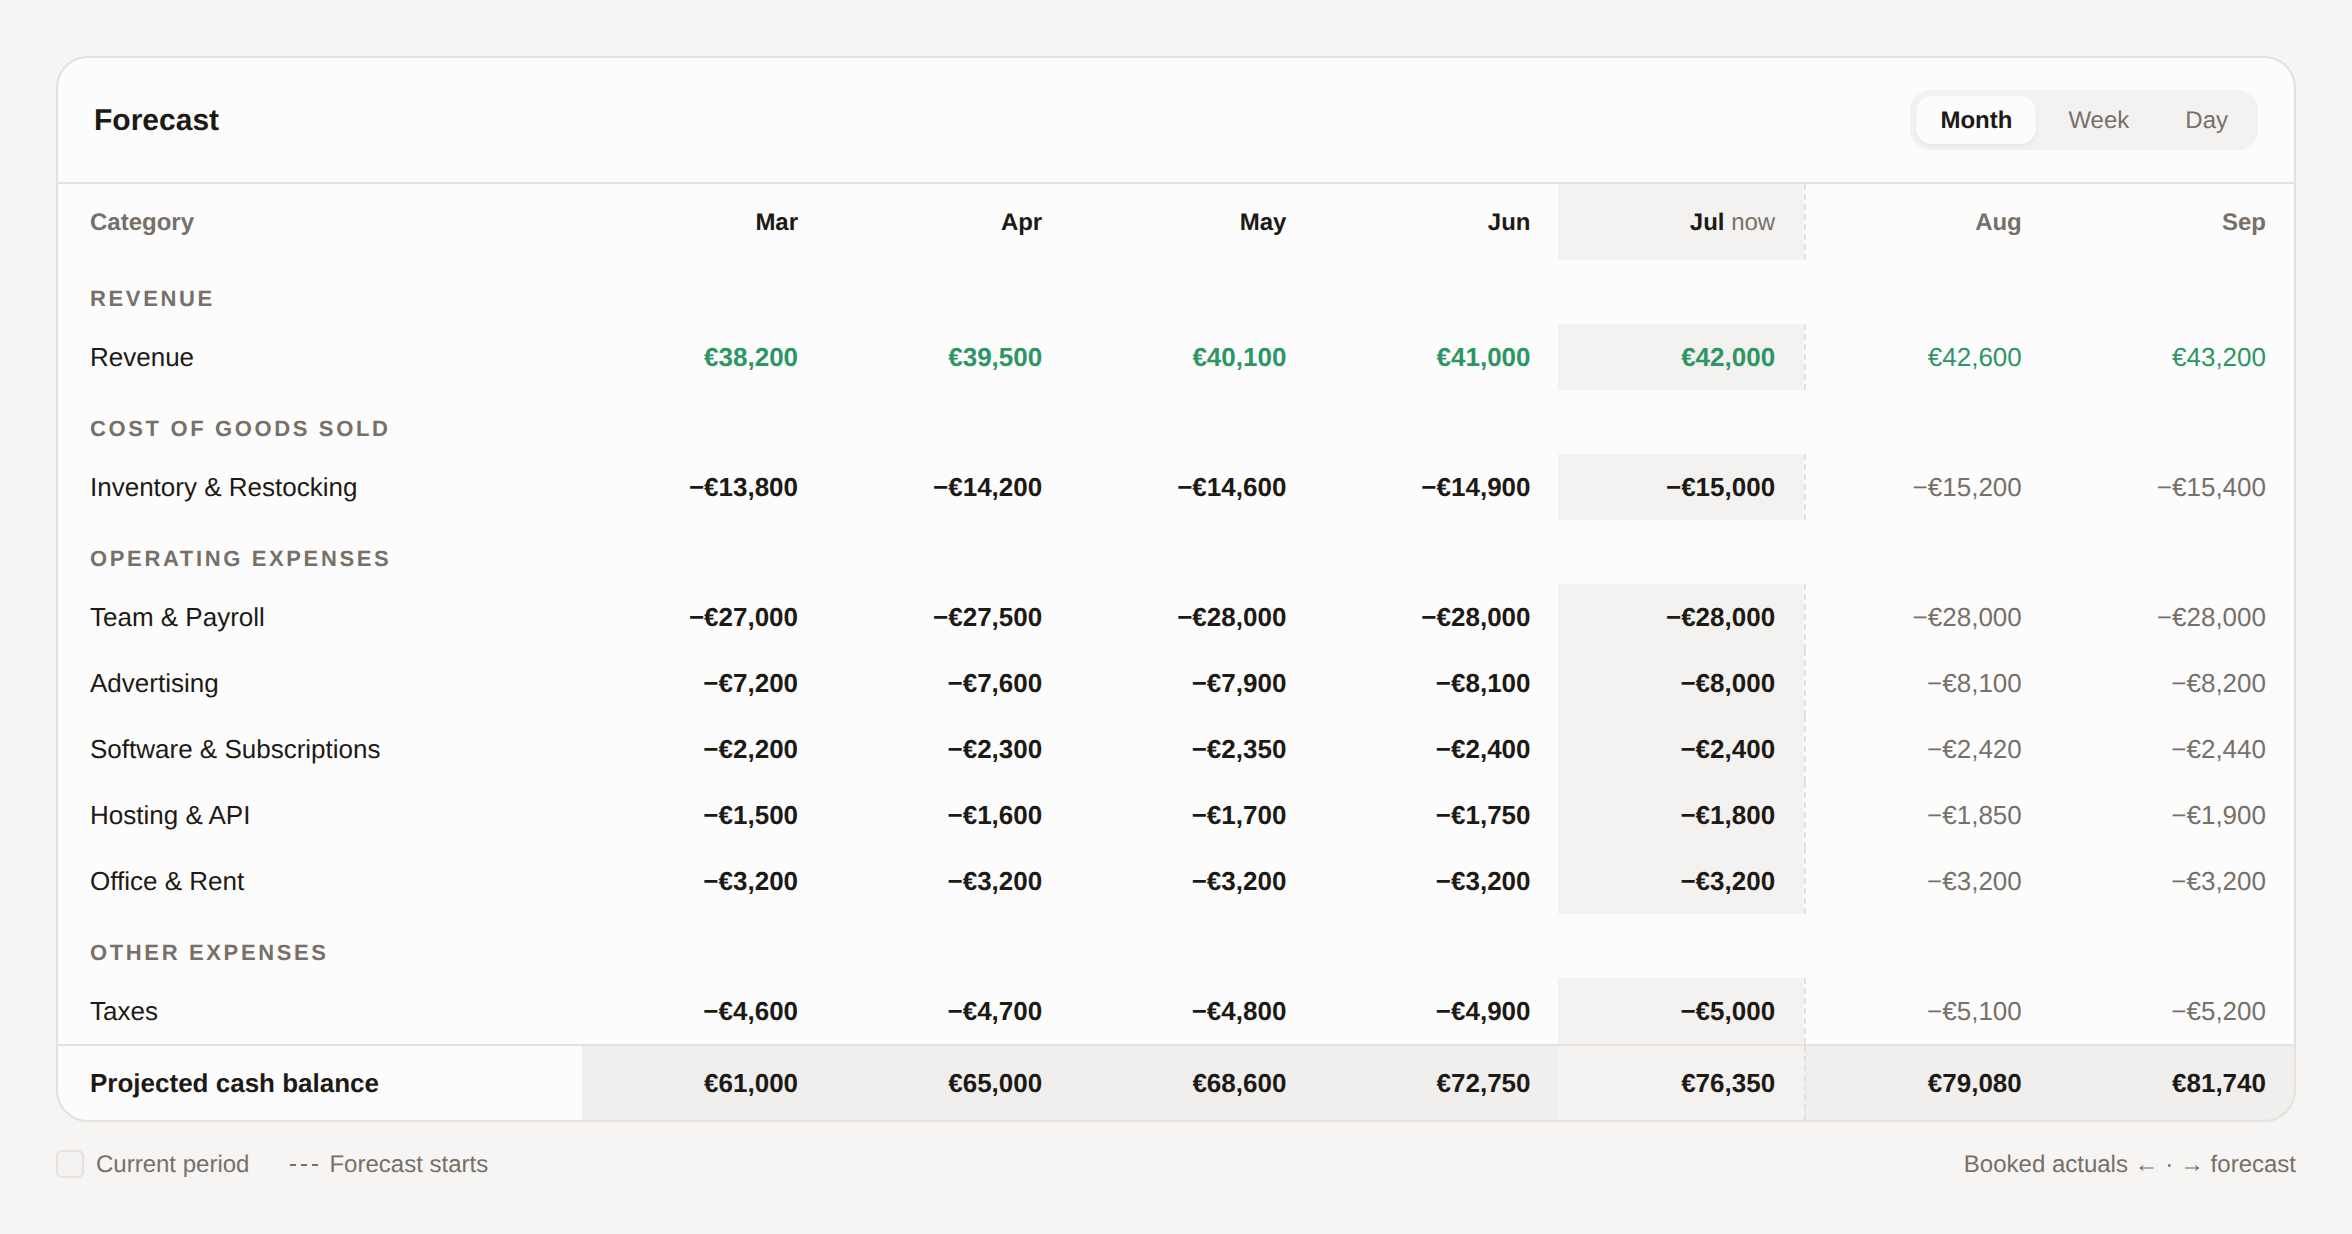
The Foreqast table is the heart of the app. It's a single, living grid that turns your booked accounting data into a rolling cashflow and profit-and-loss forecast — the past on the left as real numbers, the future on the right as a forecast, with your projected cash balance running underneath.
What it is
The table combines your P&L and cashflow in one view. Rows are categories; columns are time periods. Every future number traces back to a rule you can see — never a black box.
How your data gets in
You don't type numbers into the table. Instead, you connect a source and Foreqast keeps it current:
Every transaction is automatically sorted into one canonical category, so the same lines are used everywhere and your totals always tie out. That's the full story here — the Integrations pages cover setup in detail.
How it appears
Beneath the P&L, a Projected cash balance line takes your anchored real balance and carries it forward by each period's net income. That's what makes this one view a cashflow forecast, not just a P&L.
How it's forecast
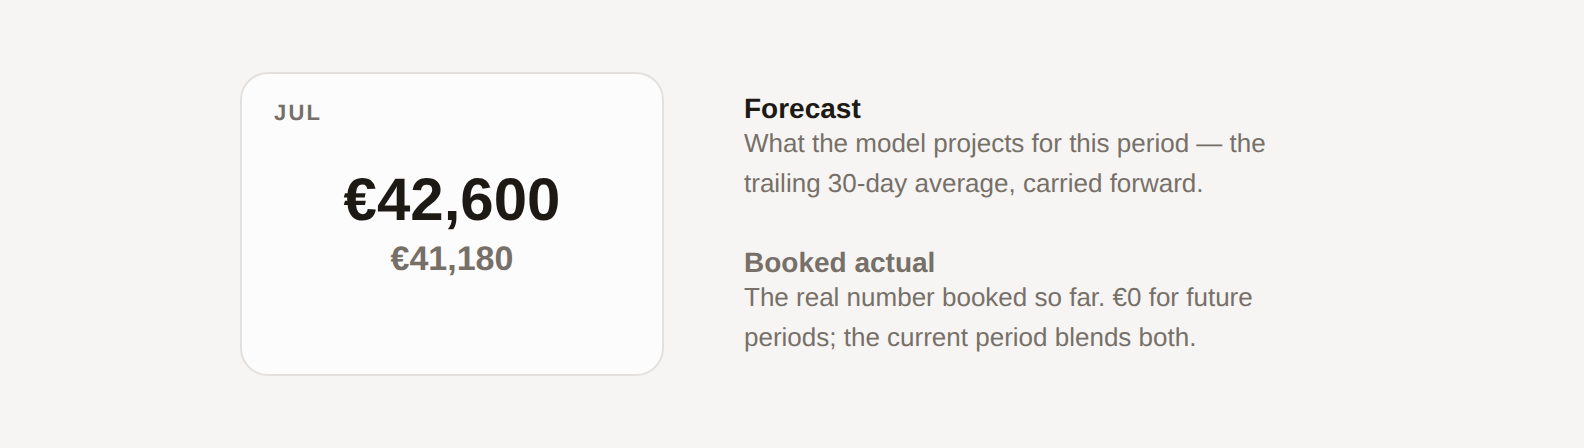
With the default setup — no extensions, drivers, or custom projections — every category is forecast historically from its own booked actuals using the trailing 30-day average. The method is the same for each line; the numbers differ.
See Categories for the full list and exactly how each line is projected. Extensions like driver-based revenue, contracts, and custom projections layer on top when you need more than history.